- Published on
Customizable product reports with Grafana and Postgres
Introduction
Reporting product usage to consumers can be a time-consuming task for companies. Smaller companies may lack the resources to build a custom reporting solution and instead resort to using spreadsheets to track product usage. However, this approach is not only time-consuming but also prone to errors in data management.
In this blog, we will demonstrate how to leverage Grafana to create visually appealing and interactive dashboards for data visualization. We will utilize Postgres as the database to store the product usage data. Additionally, to enhance security and manage access to Grafana, we benefit from Keycloak as the identity provider. Using NextJS frontend, we will provide customers with a user-friendly interface to access and explore the plots and dashboards, empowering them to gain valuable insights from the data.
The source code to run the example for this post is available on GitHub
Background
In our previous blog we demonstrated how to use Grafana to visualize data in a Postgres database. In this blog we show a use case of this setup, where we use Grafana to visualize product usage data.
Many companies have products that are used by customers, and they have a need to track the usage of these products by each consumer. To provide valuable insights to consumers, it is important to visualize this usage data in the form of plots and dashboards. Here are two real world examples of these companies:
- A car rental company wants to track the usage of their cars by customers. They want to track the distance driven by each customer, and visualize the data in forms of plots and dashboards to the customers.
- An online learning platform firm wants to track the usage of their platform by students. They want to track the number of hours spent by each student, and visualize the data in forms of plots and dashboards to the students.
In both cases we have the following common requirements:
- We need to provide each user access to their own data, and not to the data of other users.
- We want to have customizable dashboards, where the user can select the time range, and the type of plot to visualize the data.
- We have different sources of data, and we want to be able to visualize the data from different sources in the same dashboard.
Developing a custom reporting solution for each use case is time consuming, and requires a lot of resources. To avoid inventing the wheel, we can use existing tools. Grafana is a visualization tool that meets all the requirements above.
- Grafana can be integrated with Keycloak to manage the access to the dashboards.
- Grafana has a user-friendly interface to create, and customize dashboards and plots.
- Grafana has a powerful query editor to query data from different sources, it has lots of plugins to visualize the data from different sources.
In the next section we run a proof of concept implmentation of reporting product usage to consumers using Grafana, Postgres and Keycloak.
Proof of concept implementation
The code for this example is available on GitHub. Download the code using the following command:
git clone https://github.com/optiop/customizable-product-reporting
The repository contains a docker-compose.yaml file that defines the services we need to run the example. Use the following command to start the services:
docker compose up
This will start the following services:
| Service | Description | URL |
|---|---|---|
| Grafana | Visualization tool | http://localhost:3000 |
| Keycloak | Identity provider | http://localhost:8080 |
| Postgres (keycloak) | Database to store user data | http://localhost:5432 |
| Postgres (data) | Database to store product usage data | |
| NextJS | Frontend to access the dashboards | http://localhost:4000 |
The following diagram shows the architecture of the example and how the services are connected test:
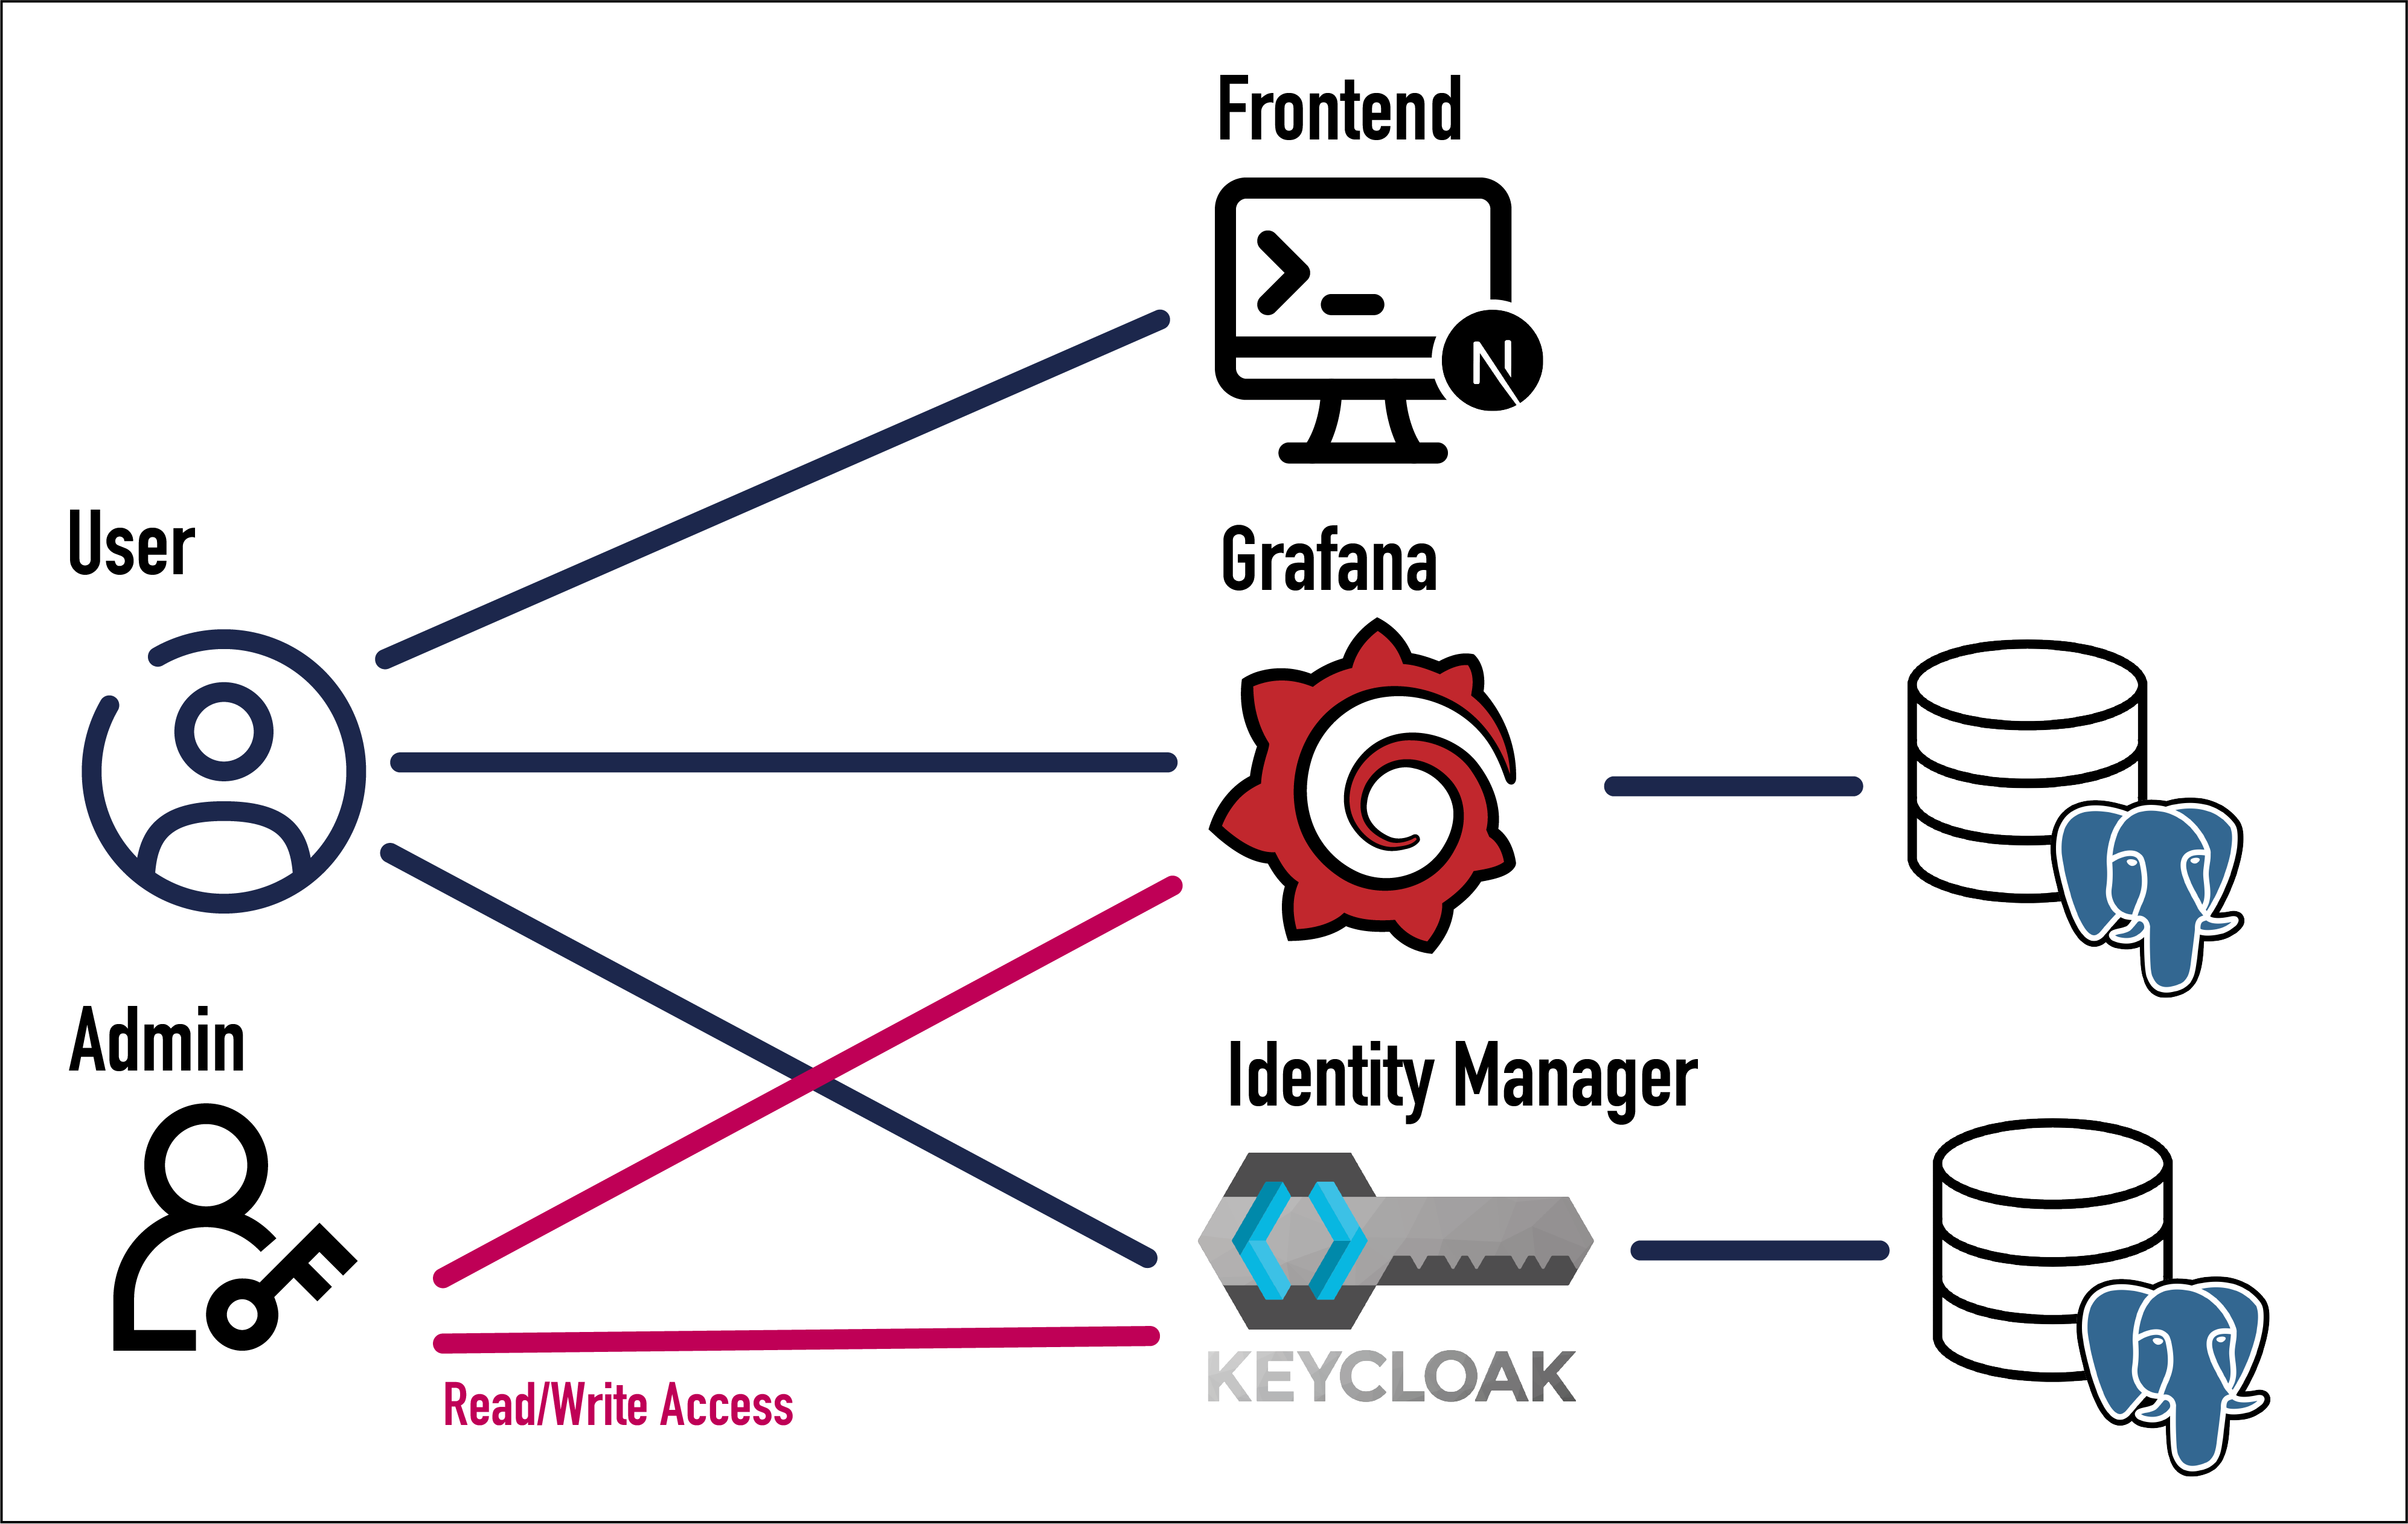
As shown in the diagram, the NextJS frontend is used to access the dashboards. The frontend is using next-auth to authenticate the users, and the provider is Keycloak. An admin user in Keycloak can create new users, and assign them to different groups. Each group has access to a different dashboard in Grafana. On the other side, Grafana is connected to the Postgres database to query the product usage data. The plots generated by Grafana is displayed in the frontend using iframes.
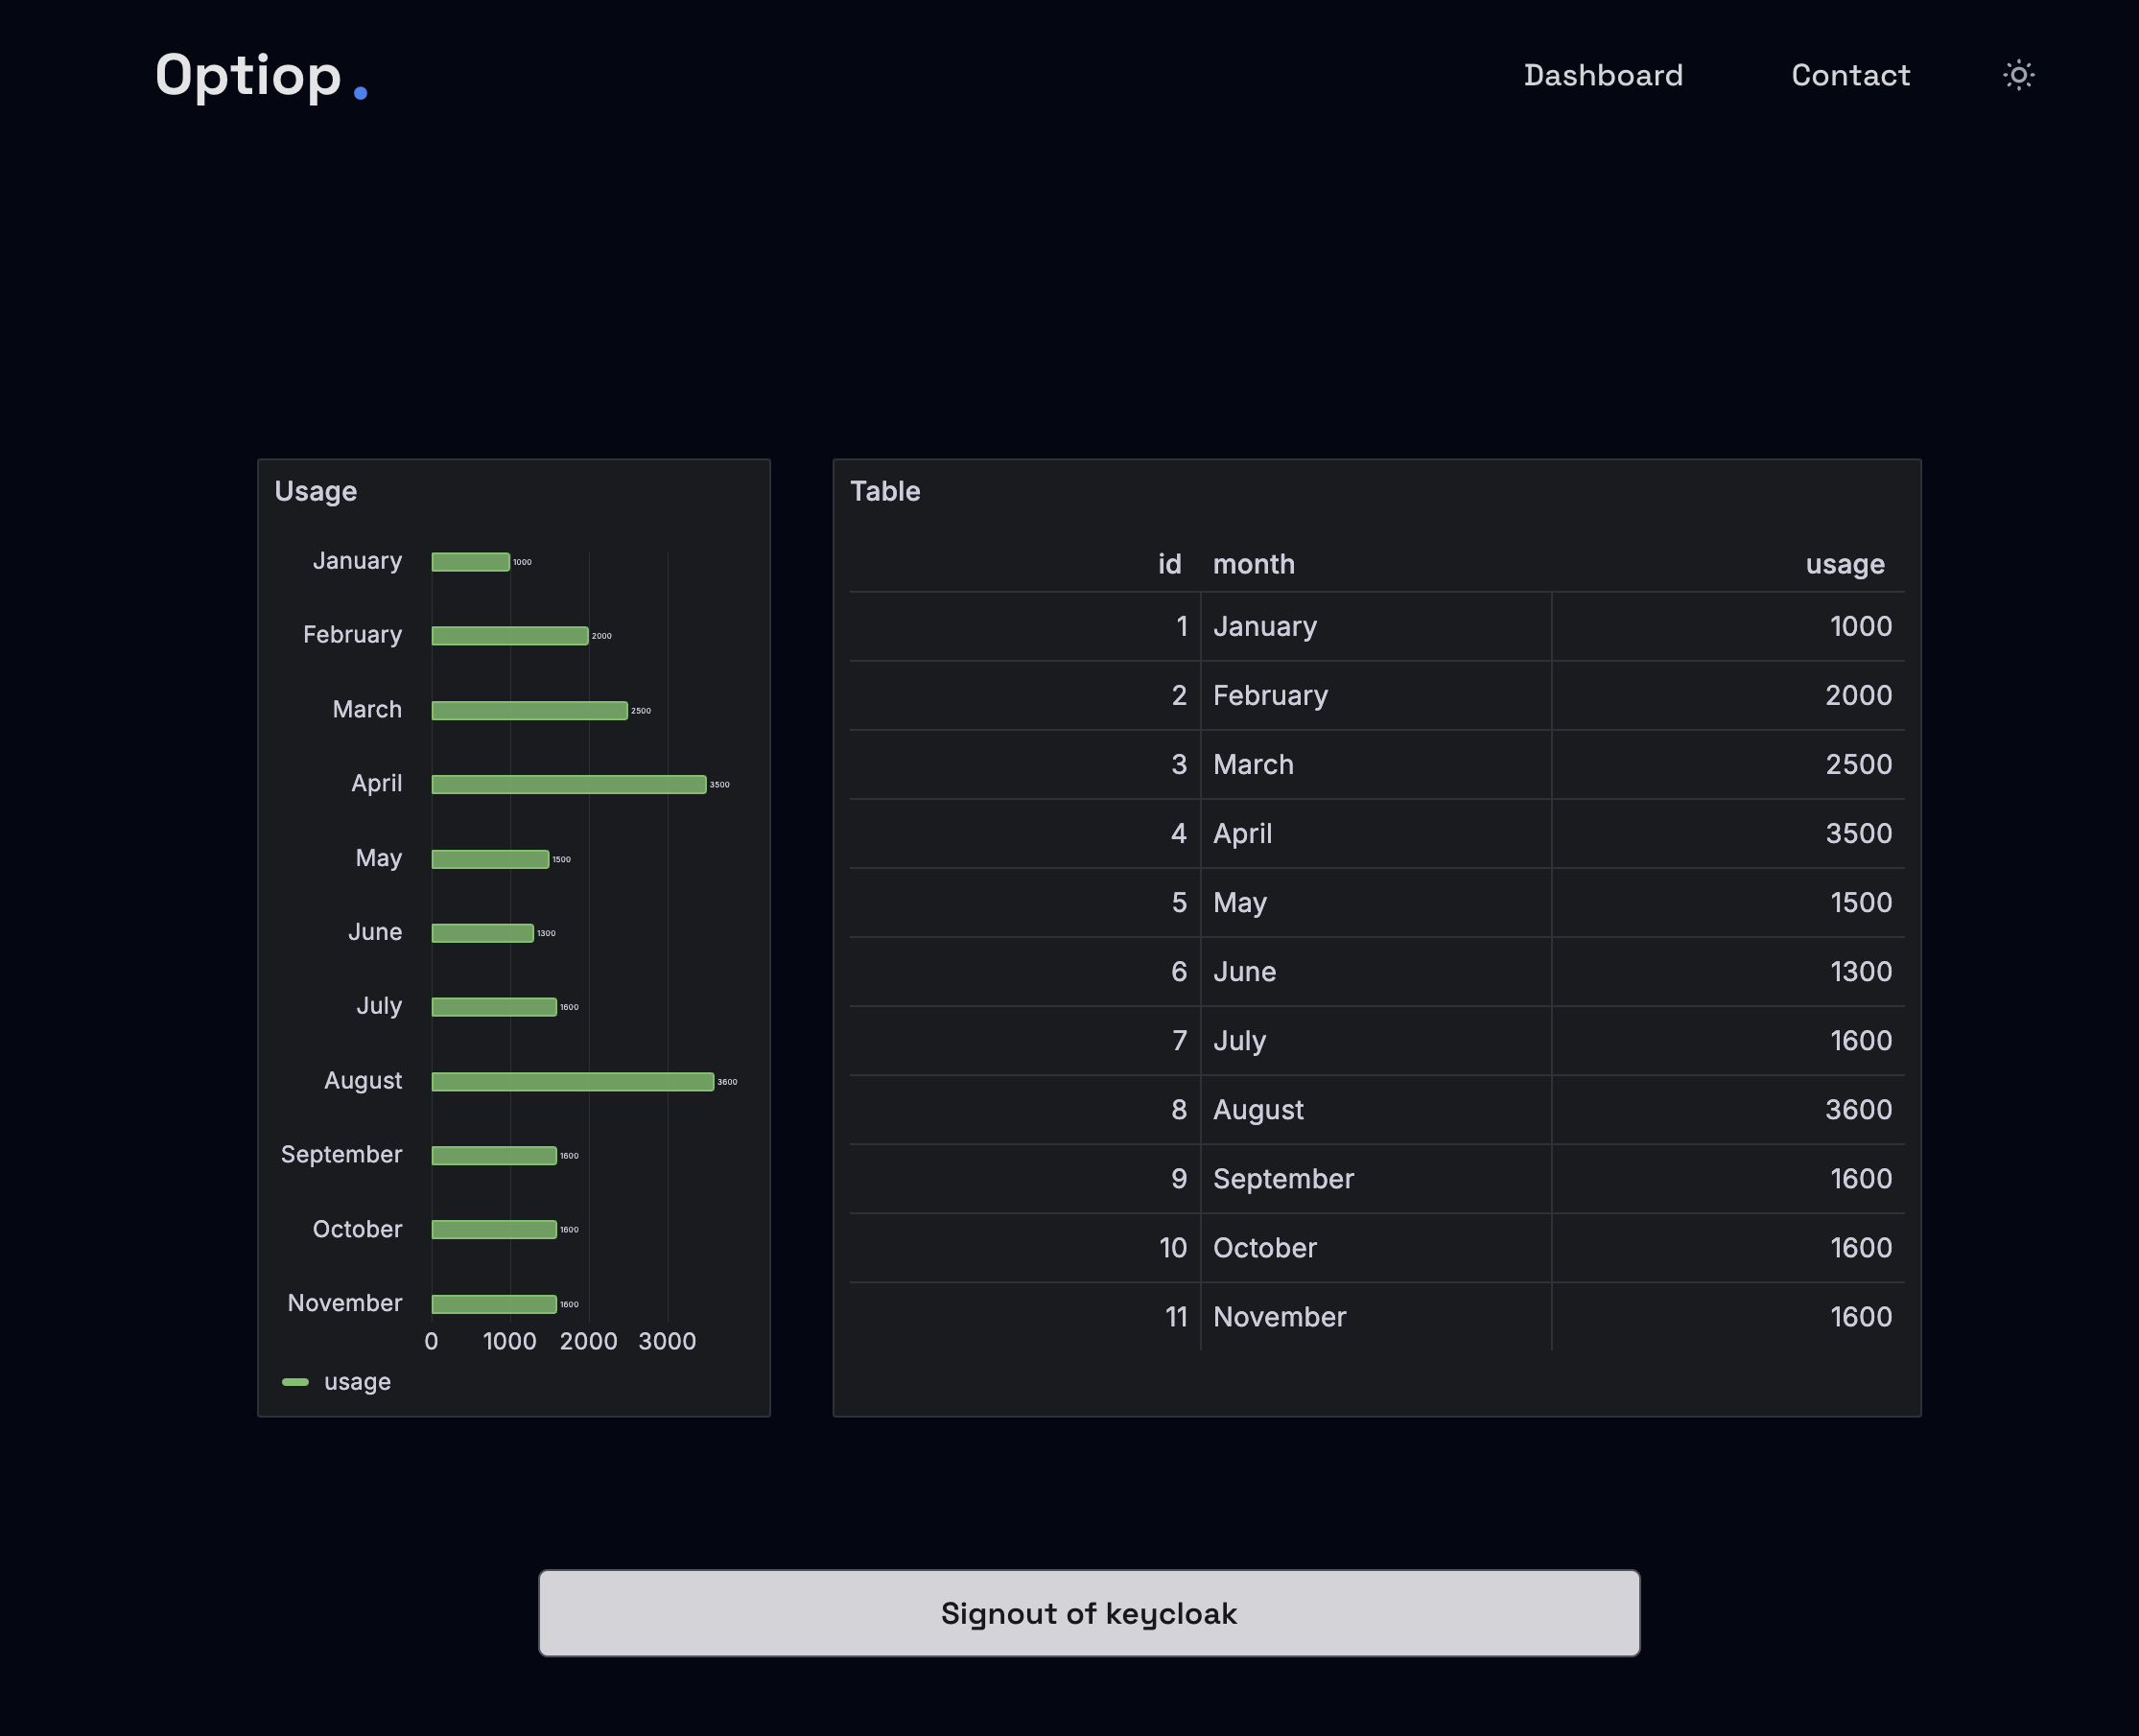
Here is the dashboard that is displayed in the frontend, showing the usage of a consumer by month:
Conclusion
We can leverage the power of Grafana to create visually appealing and interactive dashboards for product usage. It requires minimal effort to set up, and it is easy to customize the dashboards to meet the requirements of the consumers.
We at Optiop Consulting Group have experties in setting up Grafana, and we can help you to set up a similar solution for your company. Please feel free to contact us for more information.