- Published on
Visualize Postgres Data using Grafana on Elastic Container Service (ECS)
Introduction
Observability is a crucial factor in the success of any business. To achieve observability, we can leverage the power of Grafana, an open-source platform that enables us to query, visualize, alert , and understand our metrics.
In this blog we demonstrate how can use Grafana to visualize data in our Postgres database. Furthormore, we deploy Grafana on Amazon Elastic Container Service (ECS), a fully managed container orchestration service. By the end of this blog, you will have a good understanding of Grafana, and ECS.
The source code for this post is available on GitHub
- Background
- Grafana - The Open Observability Platform
- Amazon Elastic Container Service (ECS)
- Architecture Overview
- Deployment of Grafana on ECS
- Cost of Running Grafana on ECS
- Conclusion
Background
Grafana - The Open Observability Platform
Grafana is a powerful open-source platform for querying, visualizing, alerting, and understanding metrics. To get started with Grafana, we can easily run a Grafana container using the following command:
docker run -p 3000:3000 --name=grafana --rm grafana/grafana
After executing the command if we visit http://localhost:3000 in our browser, we will be directed to the Grafana login page. The default username and password for logging in are admin and admin.
Amazon Elastic Container Service (ECS)
Amazon Elastic Container Service (ECS) is a fully managed container orchestration service that allows us to run, stop, and manage Docker containers on a cluster. ECS eliminates the need to install, operate, and scale our own cluster management infrastructure. With simple API calls, we can launch and stop Docker-enabled applications, and access many features like security groups, Elastic Load Balancing, EBS volumes, and IAM roles.
Architecture Overview
The official Grafana Postgres plugin allows us to query and visualize data stored in our Postgres database. With this plugin, administrators can create alerts and visualization dashboards based on the data in the Postgres database, while users can view these dashboards and monitor the alerts.

Inside postgres-grafana-on-ecs/src/ we have setup a development environment. The docker-compose.yml file contains two services:
postgres- A Postgres database container. The container usesinit.sqlto create a table and insert some data into it.grafana- A Grafana container. The container usesprovisioning/datasources/postgres.yamlto configure the Postgres data source.
To start the development environment, we can run the following command inside the postgres-grafana-on-ecs/src/ directory:
docker compose up
After running the command, we can visit http://localhost:3000 in our browser and log in to Grafana using the default username and password admin.
Deployment of Grafana on ECS
To deploy Grafana, and Postgres on ECS, we create a task definition for each service. We use EC2 as the launch type for the task definition. The task definition for Grafana is as follows:
{
    "containerDefinitions": [
        {
            "name": "grafana",
            "image": "...",
            "cpu": 512,
            "memory": 512,
            "portMappings": [
                {
                    "containerPort": 3000,
                    "hostPort": 3000,
                    "protocol": "tcp"
                }
            ],
            "environment": [
                {
                    "name": "POSTGRES_USER",
                    "value": "postgres"
                },
            ],
        }
    ],
    "cpu": "512",
    "memory": "512",
}
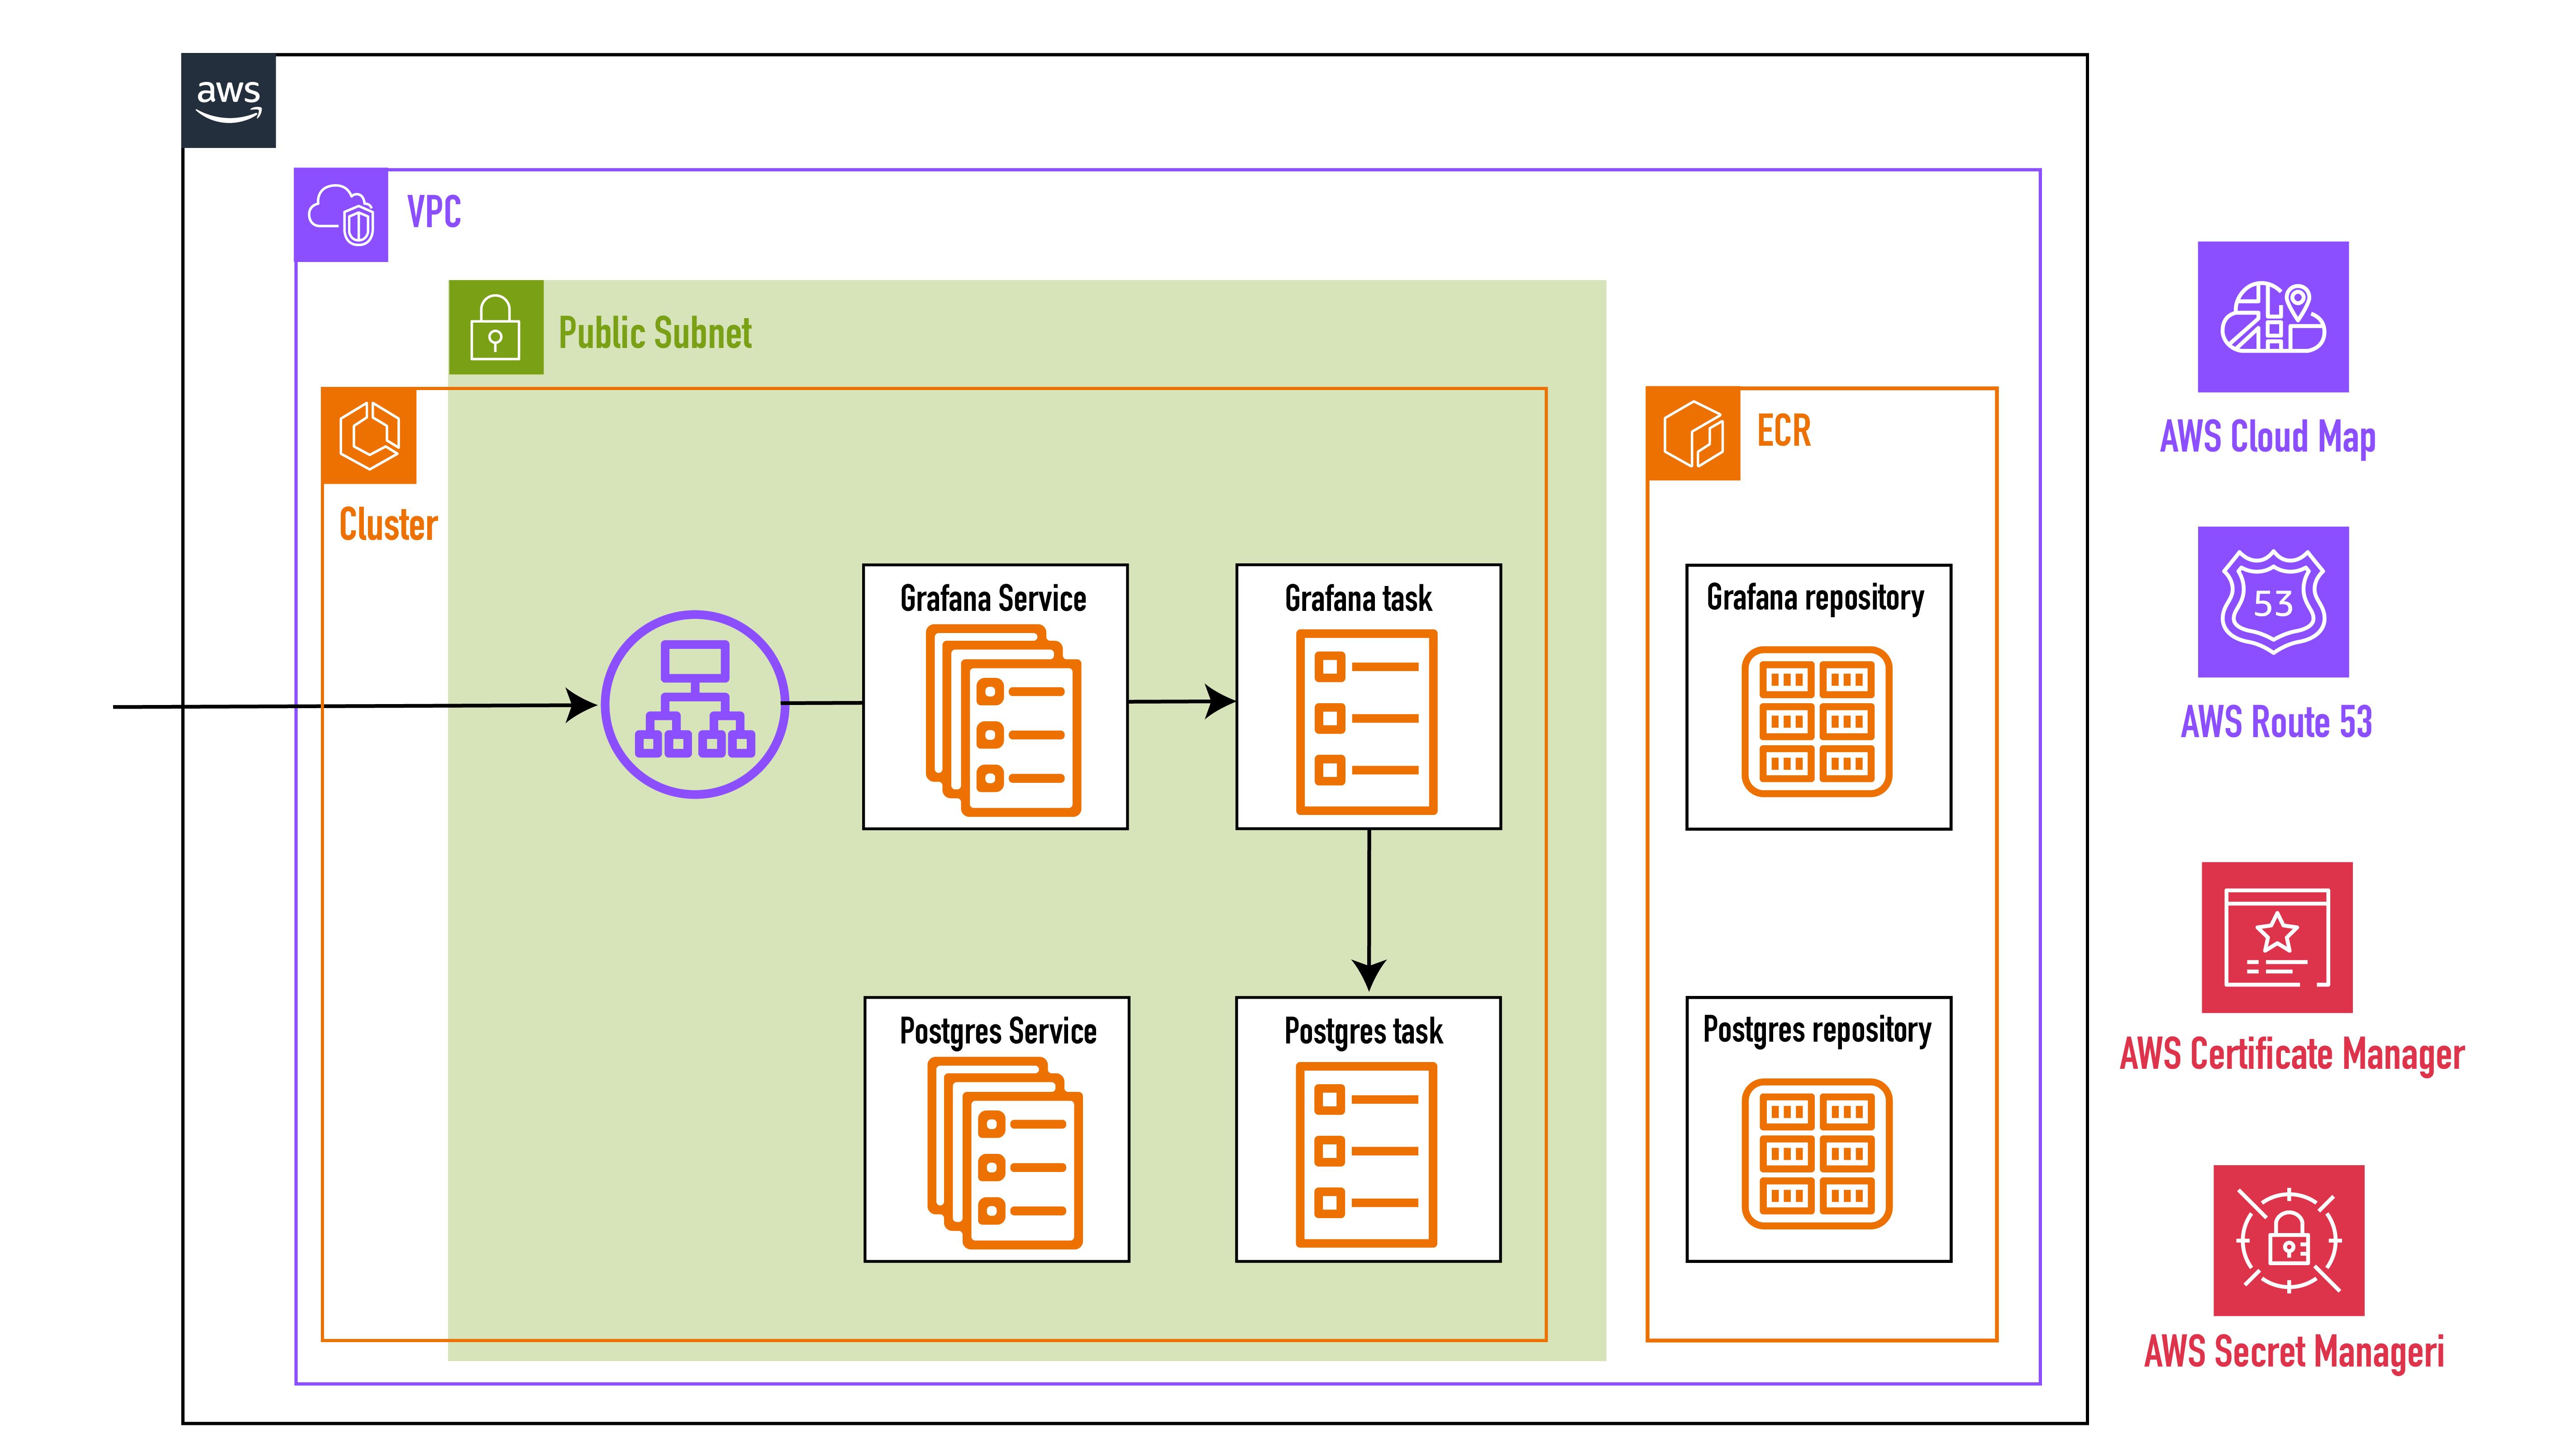
The following figure shows the deployment of Grafana on ECS. We are deploying Grafana, and Postgres tasks in a public subnet. The Grafana task is behind a load balancer, which distributes the incoming traffic to the Grafana task. The Postgres task is not behind a load balancer, and is only accessible from the Grafana task.
Cost of Running Grafana on ECS
We run the deployment for 5 hours. The cost of running Grafana, and Postgres on ECS is as follows:
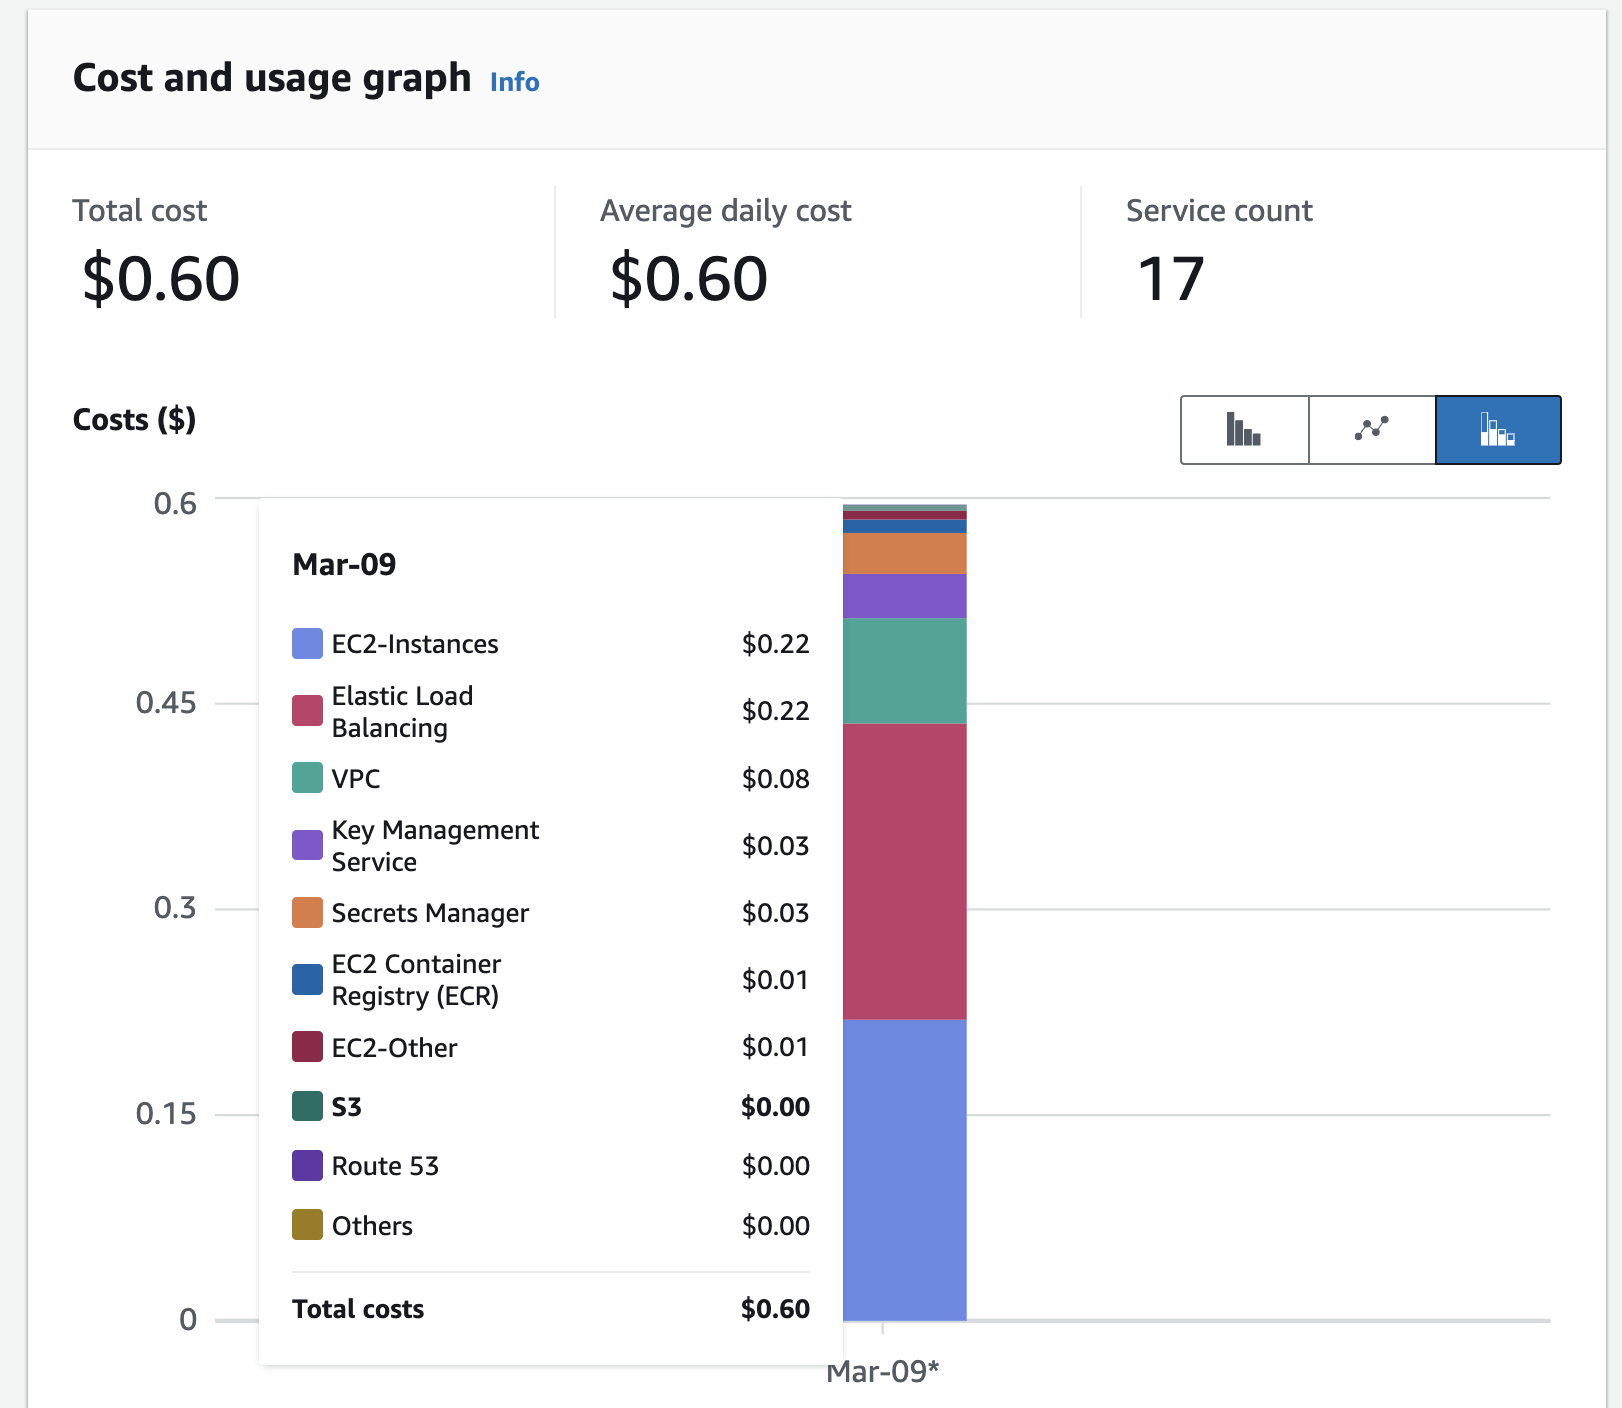
As we can see from the image, the network cost is playing a significant role in the total cost. This include the cost of load balancer, and virtual private cloud (VPC). In our case, we are using only the public subnet, which avoid the additional cost of NAT gateway.
Conclusion
Grafana is a powerful open-source platform which can be used to visualize data in our Postgres database. We can deploy Grafana as a container on Amazon Elastic Container Service (ECS) and benefits from the pay as you go model.